Desmos for the SAT · Technique 10 of 15
Find a Residual from a Line of Best Fit
How far a real point misses the model, and which direction the miss goes.
Residual = Actual minus Predicted. A positive residual means the point is above the line. The SAT's trap answer flips it to Predicted minus Actual. That one rule is the whole lesson.
A residual measures how far an actual data point sits from what a model predicts. Residual = actual y minus predicted y. Get the sign backward and you will pick the wrong answer choice even with the right numbers.
Sometimes the question hands you a residual plot instead of asking for one number. Read the shape: residual dots scattered randomly above and below zero mean the line fits well, while a clear U-shape or curve means a non-linear model fits the data better. The SAT tests that read directly.
Finding a zero, where a graph crosses the x-axis, is the same click you already learned in the first technique in this series, so if a question asks for one instead of a residual, you already know the move.


Nova
A residual is just how far a real data point misses the model line, and which way it missed: above the line or below. The SAT loves asking for one after it hands you a line of best fit, and once you know it's actual minus predicted, it's basically free points.
The algebra way vs the Desmos way
This technique sidesteps evaluating the model and subtracting by hand.
The algebra way
- Plug the x-value into the line to get the predicted value:
2(4) + 1 = 9. - Subtract observed minus predicted:
12 - 9 = 3. - Flip the order by accident and you get
-3, the right number with the wrong sign.
The Desmos way
- Define the line as
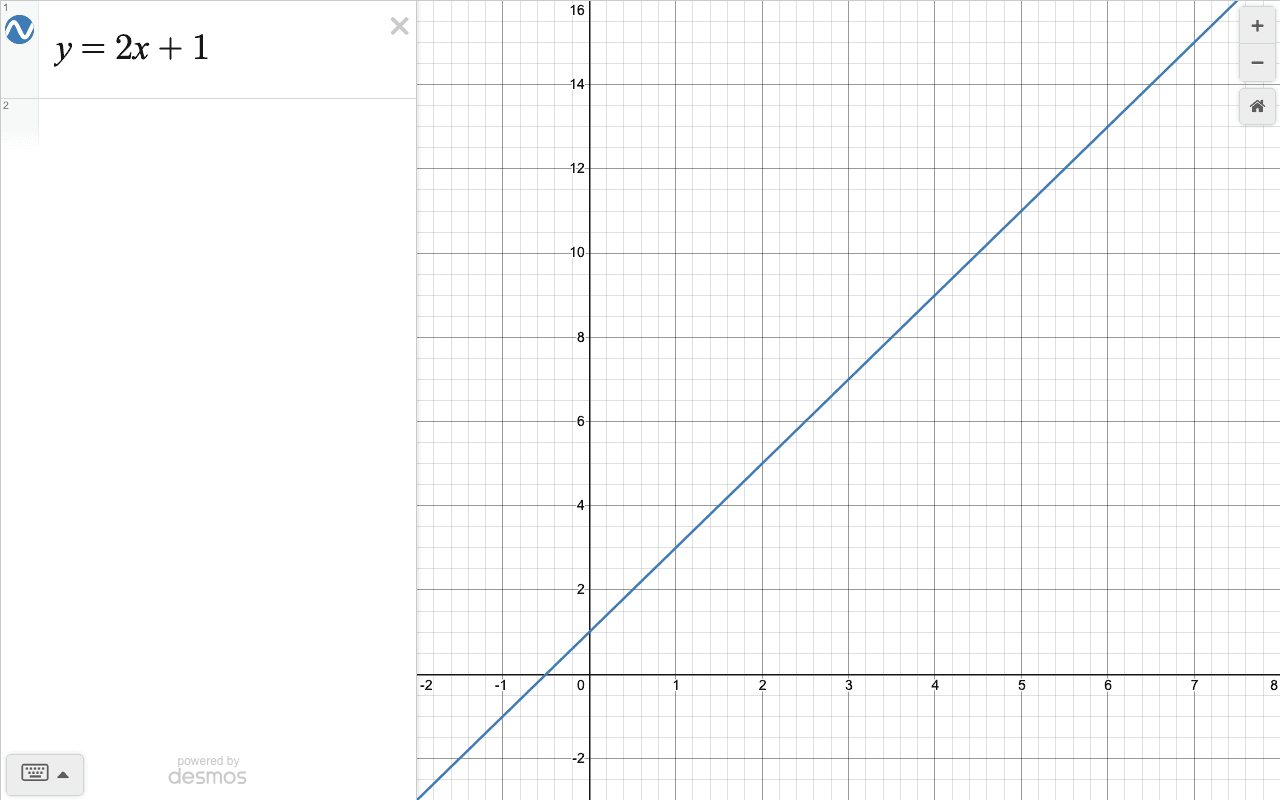
f(x) = 2x + 1. - Read the prediction
f(4), which is9. - Plot the actual point
(4, 12)and let Desmos compute observed minus predicted:12 - 9 = 3.
The payoff: Desmos does the substitution and the subtraction, so the only thing left is the sign, and the sign convention is always observed minus predicted.
See the move, live
That same example, already loaded in the real calculator, the one built into Bluebook on test day. Try the move yourself.
Before you start: set up Desmos
Convert decimals to fractions
Desmos shows decimals like 1.333. SAT choices are usually fractions. Click the round fraction-converter button next to a value to turn 1.333 into 4/3.
Use subscripts for tables
When building a table for a regression, name the columns x_1 and y_1 so the regression binds to the right data.
Turn on Projector Mode for clearer graphs
Desmos draws thin lines by default, which makes a crossing or intercept hard to pin down. Open the wrench icon (Graph Settings, top right) and turn on Projector Mode for thicker lines and larger labels, so the points you click are easier to hit exactly.
Use Zoom Fit to frame your data
After you type data into a table, the points can land off the default screen. Click the small magnifying-glass icon next to the table to Zoom Fit, and Desmos snaps the view to frame every point at once.
Widen the axis bounds when the graph looks empty
Desmos opens on a small window from -10 to 10 on both axes. If a crossing, vertex, or data point sits outside that box, the graph can look empty even when an answer exists. Open the wrench icon and widen the x and y bounds until the point you need comes into view.
Step by step

Nova
Follow along one step at a time, hit Next as you go. I'll flag the spots where people slip.

To find a zero, graph the function and click each point where the curve crosses the x-axis.
Now try it on a real SAT question
A line of best fit for a data set is given by y = 3x - 2. The actual data point at x = 5 is (5, 10).
What is the residual (actual y minus predicted y) at x = 5?
Pick an answer to get instant coaching from Nova.

Actual minus predicted, in that order, every time. Here the point sits below the line, so the residual comes out negative. Flip the order and you land on the trap answer with the wrong sign.
The model predicts y = 3(5) - 2 = 13 at x = 5. The actual value is 10, which sits below the line, so the residual is actual minus predicted: 10 - 13 = -3.
In the app, drills like this adapt to your level, and your AI coach can walk you through any step you get stuck on.
Nova
Actual minus predicted, in that order, every time. Here the point sits below the line, so the residual comes out negative. Flip the order and you land on the trap answer with the wrong sign.
Set it up yourself in the blank calculator, then read the answer straight off the graph. Muscle memory beats watching.
Watch it
The Desmos trap: when to close the calculator
- If you only need one residual and the model equation is already given, plug in the x-value by hand, it is a single substitution.
- If a question asks which point has the largest residual rather than an exact value, you can often eyeball it from a scatterplot description, the point sitting farthest from the line, without computing every residual.
- Watch the sign bait: the residual is actual minus predicted, so a point above the line is positive. The SAT plants predicted minus actual as an answer choice, which is the right size with the wrong sign.
- If you build a manual residual column, its header parameters have to match what the regression returned. If Desmos reported a and b, typing y1 - (m x1 + b) leaves m undefined and the whole column breaks.

Nova
Gut-check first: if they already gave you the model equation and you only need one residual, just plug in the x and subtract in your head. That's faster than opening Desmos. Save the calculator for when there's a scatterplot and no equation.

Put this move into real practice
"Find a Residual from a Line of Best Fit" shows up all over the real SAT. SAT Prep Quest drills the skill at your level, so reaching for it becomes automatic by test day.
Practice freeSAT is a registered trademark of the College Board, which was not involved in producing, and does not endorse, this product. Score estimates are Learner Labs projections, not official College Board scores.